3. CASE STUDY: ALMONDS CALIFORNIA
![]()
Insights from the Almond Round Table, INC May 2022 Congress
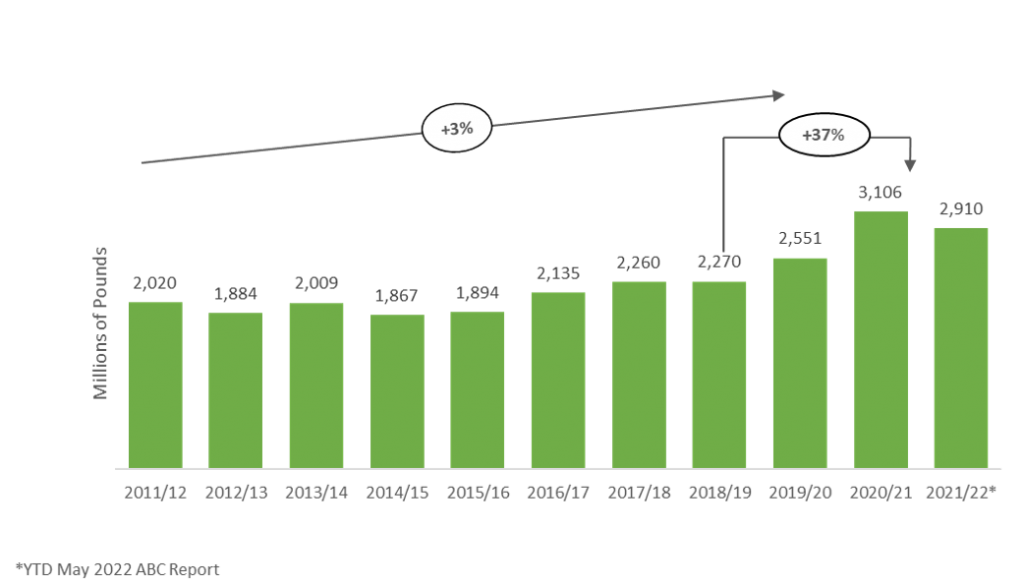
Analyzing almond receipts from California between 2011/12 and 2019/20, growth has been pretty steady at a three percent range, up to the 2020/21 season record of 3.1 billion pounds, which is a 22% increase over the prior year and a large increase of 37% over 2018/19. This significant supply rise in a short amount of time led to a lot of the challenges that the industry was facing the first half of 2022 (Figure 1).
Figure 1. California Almond Crop Receipts. Source: Almond Board of California.

Shipments over that same nine-year period were also increased by three percent, indicating that demand has been somehow constrained by that stable supply growth. Nonetheless, shipments over the last two years have not quite caught up to the increase in supply (Figure 2).
Figure 2. California Almond Crop Shipments. Source: Almond Board of California.

The Almond Board of California forecast for the 2021/22 total shipments was at over 2.8 B lbs. (ABC May 2022 Position Report); and that was a projection which, based on the year-to-date shipments seemed very challenging to reach.
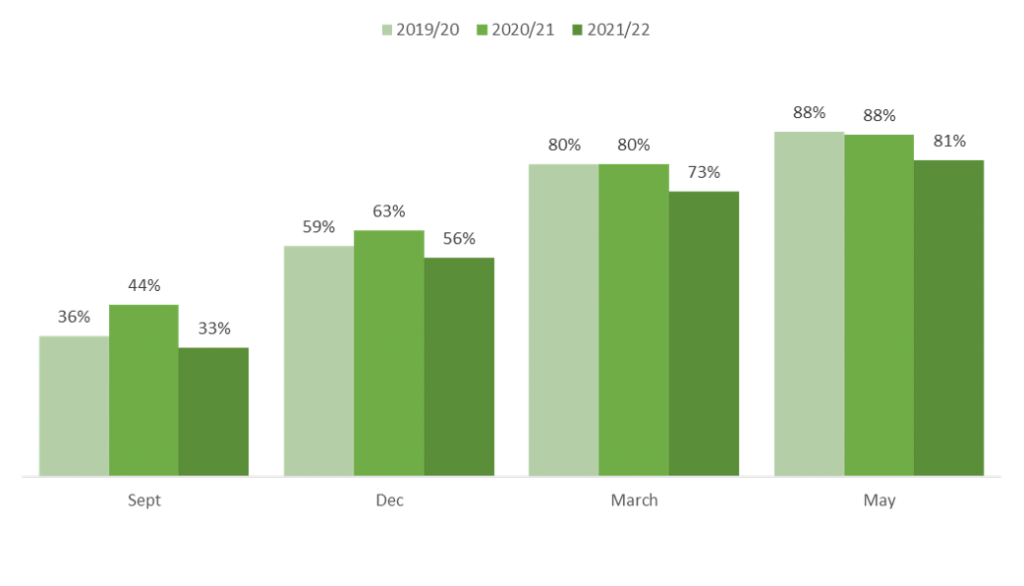
Commitments and shipments as a percent of the total supply, which is the crop estimate plus the carry-in inventory, show that the season 2021/22, starting out in September, the industry was already behind in commitments and shipments, both compared to the year before and even towards prior years. By the end of March, typically 80% of the supply is already sold, while this season, it accounted only for 73%. Through May, the gap with the previous year still remained (Figure 3).
Figure 3. Committed and Shipped as a Percent of Total Supply. Source: Almond Board of California.

Pricing historically has been very attractive and May 2022 levels were reflecting supply and demand imbalance. In early 2020/21, as the large crop was being shipped, the pricing was declining. At the start of this season, pricing came up, driven by the in-shell demand, to then settle down (Figure 4).
Figure 4. Year over Year Almond Price per Pound (USD).

Due to the affordable prices, a fraction of the shipments from the 2020/21 CY were actually pre-shipped to the European market to cover the 2021/22 CY demand. The 2020/21 season saw record shipments of 2.9 B lbs., 526 million lbs. up from the 2.3 B lbs. 2019/20 shipments. However, it is estimated that around 250 M lbs. of those 2.9 B lbs. shipments were really the carry out pre-positioned in warehouses outside of California. So, from the 526 M lbs. pound increase (shipments 2020/21 vs. 2019/20), 276 M lbs. happened in last year’s consumption, leading to an adjusted figure of 2.6 B lbs., which is a better reflection of actual demand. Following the remaining 250 M lbs. carryout into this year, with shipments expected to end up in a 2.55 B lbs. range, consumption would be in a 2.8 B lbs. range for this year; a much more reasonable trajectory from the 2.3 M lbs. in 2019/20 to 2.6 M lbs. in 2020/21 to 2.8 in 2021/22. All in all, demand continued to be very strong in spite of being traded off a bit by the shipping challenges that were faced this year (Figure 5).
Figure 5. (a) California Almond Crop Shipments, (b) California Almond Crop Carryout. Source: Almond Board of California.

Shipments regional growth continued to be impacted by logistics. Numbers for the last three years show that the US demand —the largest market— continued to be very steady. There was a slight increase in 2020/21, mainly due to COVID-19 buying patterns, while 2021/22 was back on par with 2019/20 (Figure 6).
Regarding international shipments, imports from Europe through March 2022 were down 19% from the previous year, due to the pre-shipments from 2020/21 (Figure 6a). However, as of April, Europe started buying again and by May the differential was reduced to 13%, and it was expected that buys would continue, averaging out to the prior year shipments (Figure 6b).
India is a huge market with a lot of potential for demand, which has significantly increased over the last two years and continues to follow a positive trajectory. The earlier Diwali in October 2022, means that a lot of the shipments need to come out of the 2021/22 crop, keeping prices firm as California supply starts to dwindle towards the end of the year.
The Middle East was off of last year’s levels, in spite of good Ramadan sales, as some of those shipments were not able to get into market in time. Nevertheless, shipments started to recover through April and May.
In China, the earlier Chinese New Year, the shipping issues and the spike in prices early this year created a lot of uncertainty for Chinese buyers, and a lot of the shipments did not make it in time for their stronger demand period (Figure 6).
Figure 6. Year over Year Shipments (a) August-March, (b) August-May. Source: Almond Board of California.

At the time of this report, the crop for the 2022/23 CY was forecasted at 2.8 B lbs. with a 900 M lbs. carryout, resulting in a starting supply of 3.7 B lbs. Even with a lower crop projection, the industry was likely to have a starting supply of at least 3.4 B lbs. or more for the third year in a row. Nevertheless, the future growth outlook for consumption remained positive, the US snacking category continues to be very strong, there is a lot of innovation around functional foods, and the non-dairy segment continues to grow. The US is clearly the largest market for almonds in the world and it is expected to continue to be so for a number of years. The sense that the buyers and the industry’s R&D have is that almonds are going to be very favorably priced for the near future and that keeps the new product development chain continuing at a very good pace.
In Europe, snacking is taking off and significantly starting to grow. Last year, Europe launched twice as many new products with almonds as any other region. India is the fastest growing market with a lot of potential demand as local distribution continues to increase. The Middle East has a very strong traditional affinity for almonds, which continues to be very positive for growth. In regards to European demand, at the time of writing this report, there was an uncertainty in pricing because of how strong the dollar got against the euro. Therefore, there were a lot of buyers waiting to step in depending on the exchange rate fluctuations. There was also a lot of concern about how the Russia and Ukraine situation was going to disrupt all the grain that goes into Europe, since Ukraine supplies a lot of agricultural products that go into Europe. For almonds specifically, due to their stable shelf life, the possibility to be easily converted into flour, powder or beverage at home, represents an opportunity for the almond industry.
In China, in spite of the duty limitations which declined exports, the potential for this market for Californian almonds remains. Logistics and duty issues have been the biggest obstacles to getting any consistent demand in China as of late, while in the past it was really price-driven. So, as long as the supply chain and tariff issues can get worked out, China continues to have a tremendous growth potential.
Last but not least, the drought and water supply in California remain a challenge; 50% of the California water usage goes to the environment, 40% into agriculture and 10% into urban areas. Water supply comes from two sources, from surface water and from ground water. The surface water is the runoff from the snowpack going into the rivers and streams. The 2022 snowpack is behind the average. The groundwater use supplies 38% to 46% of total California water use. Therefore, the drought amplifies the water challenges, it decreases the surface water availability that places a higher demand for groundwater, which is being limited, and costs continue to increase. Regulatory pressures that impact water availability are likely to continue and that is going to be a limiting factor for California agriculture as acreage continues to expand (Figure 7).
Figure 7. California Almond Acreage. Source: USDA Agricultural Statistics Service.

| Key Takeaways |
|


